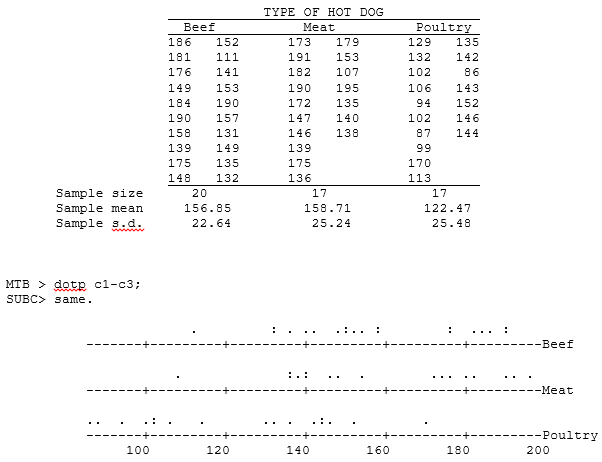
Introduction to Problems 4 and 5. In June 1986, Consumer Reports conducted a survey in which hot dogs of three types were sampled and measured for calorie content: All Beef, Meat (mainly pork, but may also contain beef and poultry), and Poultry. Although the survey was not conducted as a random sample of hot dogs of each type, we treat the data as if they are random samples from three normal distributions with equal variances. The data were entered into columns c1-c3 of a Minitab worksheet. The data and the results of several Minitab procedures are shown below.
5. The introduction, data, and computer printouts for this problem are given on page 3. In this problem we consider data from all three types of hot dogs, and wish to know if there are any significant differences among their population mean calorie levels.
(a) State the appropriate null hypothesis and its alternative both in symbols and in words.
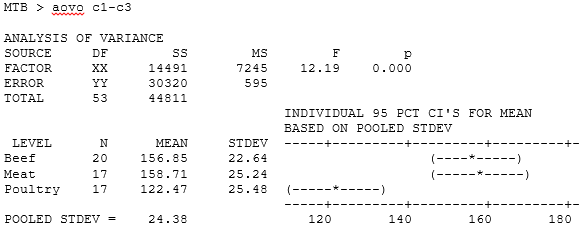
(b) Give the numerator and the denominator degrees of freedom for the F-distribution relevant to this test. (In the printout they have been replaced by XX and YY.)
Numerator df = Denominator df =
(c) Show how the F-statistic (12.19) is obtained from two other values in the ANOVA table.
Explain why you should conclude that there are significant differences among hot dog types at the 5% level. Give your explanation — both in terms of the F-statistic and in terms of the P-value.
(d) State the assumptions involved in performing this kind of statistical procedure.
(e) Interpret the confidence intervals in the Minitab printout and summarize your conclusion(s) about the overall pattern of population means in a brief non-technical sentence.
Students succeed in their courses by connecting and communicating with an expert until they receive help on their questions

Consult our trusted tutors.


 Login | Sign Up

