The curve in FIGURE 1 shows the response of a bare thermocouple
Ask Expert

Be Prepared For The Toughest Questions

Practice Problems

The curve in FIGURE 1 shows the response of a bare thermocouple

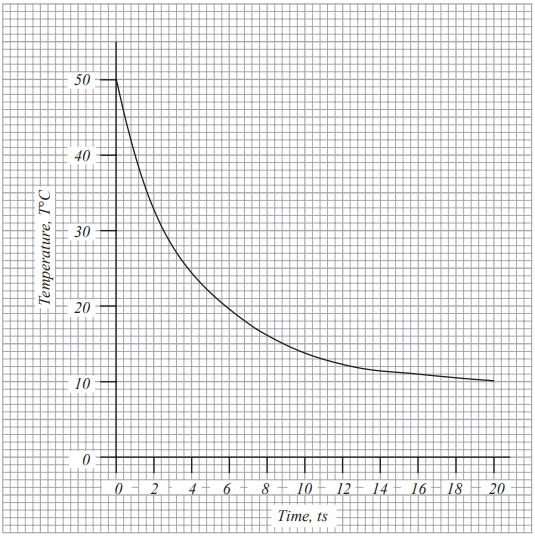
2. The curve in FIGURE 1 shows the response of a bare thermocouple which has been subjected to a step change in temperature from 50°C to 10°C. Assuming that the bare thermocouple behaves as a single transfer lag system, determine the mathematical relationship between the temperature (T) and time (t) [i.e. determine the equation relating T to t].


Hint
EngineeringIn order to create a progressive shift in direction, curves are regular bends built into communication lines like roads, railroads, etc. In order to prevent an abrupt change in slope at the apex, they are also utilized in the vertical plane at all changes in grade....

Know the process

Students succeed in their courses by connecting and communicating with
an expert until they receive help on their questions

1
img

Submit Question

Post project within your desired price and deadline.

2
img

Tutor Is Assigned

A quality expert with the ability to solve your project will be assigned.

3
img

Receive Help

Check order history for updates. An email as a notification will be sent.

img
Unable to find what you’re looking for?

Consult our trusted tutors.

Developed by Versioning Solutions.