The following table shows the breakdown of a population into categories of gender
Ask Expert

Be Prepared For The Toughest Questions

Practice Problems

The following table shows the breakdown of a population into categories of gender

Task 01

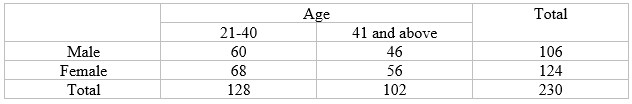
The following table shows the breakdown of a population into categories of gender and age (frequencies are in thousands).


1. Differentiate primary and secondary data collection methods (six points should be given)

2. Mention three differences between probability and non-probability sampling methods

3. A researcher wants to construct a quota sample of 100 individuals which fully reflects the distribution of these two characteristics in the population. Calculate the numbers in each category of the quota sample

Hint
Statistics"2.) Non-probability sampling can be defined as the sampling method by which not all of the members of the population have the equal chance of participating in the research. Contrast to probability sampling every member of the population knows the chance of it being selected."...

Know the process

Students succeed in their courses by connecting and communicating with
an expert until they receive help on their questions

1
img

Submit Question

Post project within your desired price and deadline.

2
img

Tutor Is Assigned

A quality expert with the ability to solve your project will be assigned.

3
img

Receive Help

Check order history for updates. An email as a notification will be sent.

img
Unable to find what you’re looking for?

Consult our trusted tutors.

Developed by Versioning Solutions.