Problem 2. The following table shows the numbers of patients classified as underweight, normal weight, overweight and obese according to their diabetes status.
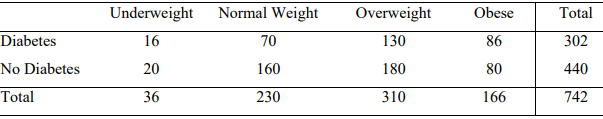
If a patient is selected at random,
a) What is the probability that they are overweight (e.g., what is the proportion that is overweight)?
b) What is the probability that a randomly chosen diabetic patient is obese?
c) What proportion of patients are normal weight or underweight?
Students succeed in their courses by connecting and communicating with an expert until they receive help on their questions

Consult our trusted tutors.


 Login | Sign Up

