Statistics
"To answer these questions using RStudio, you can follow the steps below. Assuming you have the final exam dataset loaded in RStudio as a data frame named final_exam_data, and that it contains columns such as ""Hospital_Type,"" ""Hospital_Net_Benefit,"" ""Hospital_Cost,"" and ""Hospital_Revenue,"" here's how you can perform the requested analyses:
# Load necessary libraries
library(dplyr)
library(ggplot2)
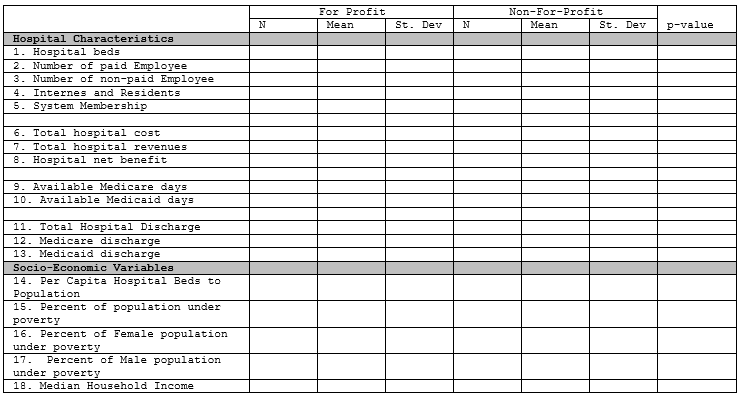
# 1) Compare the following information between for-profit and non-for-profit hospitals.
# You can use the group_by and summarize functions to compare means or other statistics for the two types of hospitals.
summary_stats <- final_exam_data %>%
group_by(Hospital_Type) %>%
summarize(
Mean_Hospital_Net_Benefit = mean(Hospital_Net_Benefit),
Median_Hospital_Net_Benefit = median(Hospital_Net_Benefit),
# Add more summary statistics as needed
)
# 2) What are the main significant differences between for-profit and non-for-profit hospitals?
# To compare the differences between for-profit and non-for-profit hospitals, you can use statistical tests like t-tests or Wilcoxon rank-sum tests.
# Choose the appropriate test based on the data distribution and assumptions.
# For example, if the data is not normally distributed, you can use a Wilcoxon rank-sum test.
# Perform a t-test for demonstration:
t_test_result <- t.test(
Hospital_Net_Benefit ~ Hospital_Type,
data = final_exam_data
)
# 3) Use a box plot and compare Hospital net benefit between for-profit and non-for-profit hospitals.
# Create a box plot to visualize the distribution of net benefits by hospital type.
boxplot_plot <- ggplot(final_exam_data, aes(x = Hospital_Type, y = Hospital_Net_Benefit)) +
geom_boxplot() +
labs(x = ""Hospital Type"", y = ""Hospital Net Benefit"")
# 4) Show another scatter plot and compare hospital cost (x-axes) and revenue (y-axes) and discuss your findings.
scatter_plot <- ggplot(final_exam_data, aes(x = Hospital_Cost, y = Hospital_Revenue, color = Hospital_Type)) +
geom_point() +
labs(x = ""Hospital Cost"", y = ""Hospital Revenue"")
# 5) Comparing hospital net-benefit, which hospitals have better performance?
# Compute the net benefit difference and perform a t-test.
final_exam_data$Net_Benefit_Difference <- final_exam_data$Hospital_Revenue - final_exam_data$Hospital_Cost
t_test_net_benefit <- t.test(
Net_Benefit_Difference ~ Hospital_Type,
data = final_exam_data
)
# 6) Overall, what are the main significant differences between for-profit and non-for-profit hospitals?
# You can summarize your findings from the previous analyses to answer this question.
# Display the results
summary_stats
t_test_result
t_test_net_benefit
# Display the box plot
print(boxplot_plot)
# Display the scatter plot
print(scatter_plot)
# Summarize the main differences between for-profit and non-for-profit hospitals
# Based on your analysis, provide an interpretation of the differences.
# Make sure to save your analysis and results for reporting."


 Login | Sign Up

