12. A regional supplier of jet fuel is interested in forecasting its sales. These sales data are shown for the period from 2002Q1 to 2017Q4 (data in billions of gallons):
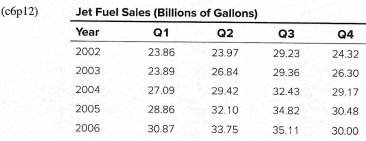
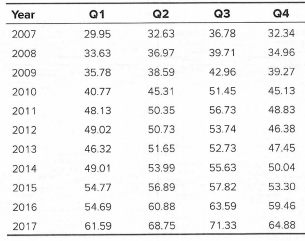
a. Prepare a time series graph of these data. What, if any, seasonal pattern do you see in the plot? Explain.
b. Use ForecastXTM to make a time series decomposition forecast for 2018. Write a brief report explaining your forecast. Include a graph of the fitted values, the forecast values, and the actual sales.
c. Develop two other forecasts of jet fuel sales using the following methods:
1. A Winters' exponential smoothing model; and
2. A regression model using just time and quarterly dummy variables.
Compare the MAPEs for the three models you have developed, and comment on what you like or dislike about each of the three models for this application.
Students succeed in their courses by connecting and communicating with an expert until they receive help on their questions

Consult our trusted tutors.


 Login | Sign Up

