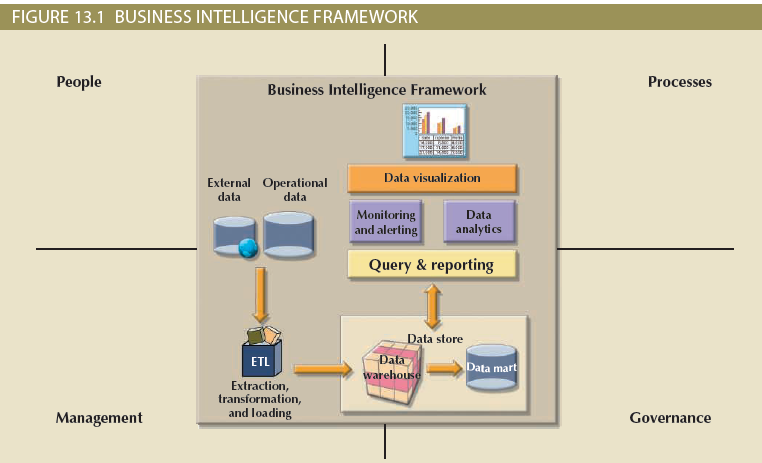
Business intelligence (BI) is a term that describes a comprehensive, cohesive, and Integrated set of tools and processes used to capture, collect, integrate, store, and analyse data with the purpose of generating and presenting information to support business decision making. Components of the BI framework are given in the Figure 3.

Figure 3: Components of the BI framework
Answer following questions.
a. Why is data visualisation important in Business Intelligence?
b. Tableau (www.tableau.com) is a data visualization tool. Tableau can help anyone see and understand their data. Connect to almost any database, drag and drop to create visualizations.
Install Tableau Public (https://public.tableau.com/s/ ) on your laptop / computer and create any 2 visualisations. Follow the following instructions:
i. First go to Tableau Public https://public.tableau.com/s/ and enter your email address and select “Download the App”
ii. Then you can download the software and run the .exe file to install.
iii. Now you will get the following starting screen. Here you can upload MS excel or MS Access file. Watch this video to find more details on “How to”. https://public.tableau.com/en-us/s/resources
iv. You can use any MS excel, MS Access file or any data file to create 2 visualisations. It should be your own individual work.
Students succeed in their courses by connecting and communicating with an expert until they receive help on their questions

Consult our trusted tutors.