Activity 7: TOP T Framework: Airline Traffic
Your team has just handed you the slide below, and you have to present to your company's senior leadership team in five minutes. Take a moment to:
• Write down the topic.
• Circle all the elements on the graph to which you want to orient the audience.
• Decide if the headline given is an appropriate point. If not, write a better point.
• Write out the transition to a hypothetical next slide (you can choose whatever content you want to come next).
Then present the slide as if you support all the design choices. Remember, in real life you won't always have time to craft the perfect slide. Use this as a chance to practice presenting with confidence. Lack of confidence in delivery can accidentally signal lack of confidence in the analysis. Practice displaying confidence in the analysis through confidence in the delivery.
• To improve faster, record yourself and play it back. Ask yourself the following questions to make sure you are presenting the slide clearly:
1. 1. How clear was your topic?
2. 2. To which elements of the graph did you orient? Which ones did you miss? What terms or choices warranted more explanation?
3. 3. How could you have stated the point more clearly?
4. 4. How could you have improved the transition to the next slide?
Compare your choices to the sample scripts after the slides. Notice what you like about the sample scripts. Notice where you think they could be improved. There's no one way to present a slide. Cultivate a sense of what you think works by observing other people's choices.
Use complex graphs when the underlying data is complex and the complexity is critical to your point.
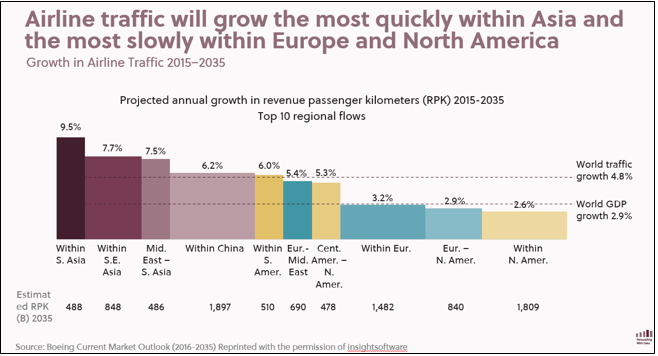
For the slide below, it’s important to know that RPK (Revenue Passenger Kilometers) is a measure of airline activity. It measures the number of paying passengers (revenue passengers) multiplied by the number of kilometers they flew. An airline that runs a single 1,000-kilometer flight with 100 passengers has an RPK of 100,000 (1 flight * 1,000 Km * 100 passengers). An airline that carries 200 passengers twice as far has an RPK of 400,000 (1 flight * 2,000 Km * 200 passengers).
Assume that you are delivering this slide in 2015 and practice the discipline of fully orienting the audience to every element and calculation on the slide.
Then, fill out the following table and include it in your answer sheet. This table is the only required deliverable for this activity, not the questions posed above.
Students succeed in their courses by connecting and communicating with an expert until they receive help on their questions

Consult our trusted tutors.


 Login | Sign Up

