Activity 3: Declutter + Gestalt Principle (Connection): Power outage Hurricane Irma/Wilma
Redraw the messy Hurricane Irma/Wilma graph below to improve it. Use the data in the tab Activity 3: Hurricane Irma Wilma. Think about choosing the best graphical form and maximizing the data–ink ratio. You must use Gestalt Principle of connection (effectively) in your revised visualization. Use the information provided about the audience and the context of the discussion to make choices that focus the audience on the key comparison. For this activity, submit only one slide with the visualization and any other detail you want to include.
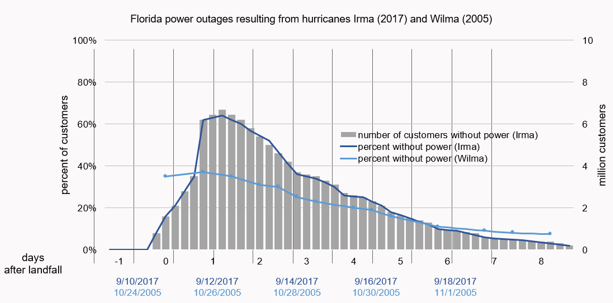
Power outages following Hurricanes Wilma and Irma
Context
An introductory slide as part of a longer presentation
Audience
Community leaders seeking an update on how well Florida recovered from Hurricane Wilma as compared to Irma
Communicator
A trusted representative from the US Energy Information Administration, which measures issues related to US energy infrastructure
Goal
Indicate that Hurricane Irma left more customers without power than Hurricane Wilma, but recovery from hurricane Irma has been faster
Students succeed in their courses by connecting and communicating with an expert until they receive help on their questions

Consult our trusted tutors.


 Login | Sign Up

