Research Problem 1: Big-Five Personality Traits and Optimism
Use the Research Problem 1 description and the BigFive_Optimism.sav SPSS dataset to complete the instructed tasks and obtain statistics needed to answer exam questions 1–12 included below.
QUESTION 1
How many males and how many females were included in the sample of 95 participants?
(Hint: Request frequency tables on participant sex in SPSS.)
QUESTION 2
What percentage of the sample identified their ethnicity as African American/Black?
(Hint: Request frequency tables on participant ethnicity in SPSS.)
QUESTION 3
Summarize the age characteristics in the sample of 95 participants. In your response include each of the following:
1. The range of ages represented in the sample
2. The mean, median, and mode
3. The standard deviation
4. Description of the shape of the distribution of age
(Hint: Request descriptive statistics on participant age in SPSS.)
QUESTION 4
Assume any participant who had an Optimism score less than 18 (i.e., had a score of 17 or lower) was categorized as pessimistic. How many participants in our sample would be considered pessimistic? )Hint: Request frequency tables on Optimism in SPSS.)
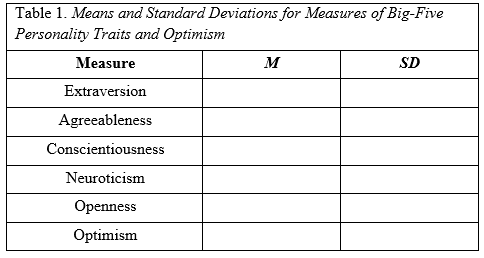
QUESTION 5
Obtain the means and standard deviations for the measures of the Big-Five personality traits and optimism in SPSS. Use the descriptive data to fill in Table 1 below. Round each statistic to two decimal places.
QUESTION 6
Conduct an independent-samples t-test in SPSS to examine if there are any sex differences in neuroticism scores. Copy and paste (or import) the t-test output below.
QUESTION 7
Summarize the results of the t-test output provided for Question 6 above. In your summary, be sure to address the following:
a. Indicate if the assumption of homogeneity of variance was met
b. Interpret the t-test results and report the results in correct statistical notation
c. Report the mean and standard deviation neuroticism scores for males and females and interpret the findings (i.e., did males or females have higher neuroticism scores than the other sex?)
d. Report and interpret an appropriate measure of effect size
QUESTION 8
Obtain Pearson correlation coefficients in SPSS to examine the relationships between extraversion, agreeableness, conscientiousness, neuroticism, openness, and optimism. Copy and paste (or import) the Pearson correlation matrix output below.
(Hint: In the Bivariate Correlations menu in SPSS, include all six variables to create a correlation coefficient matrix in your output.)
QUESTION 9
Using the correlation output provided for Question 8 above, interpret and report the correlations between each of the Big-Five personality factors (extraversion, agreeableness, conscientiousness, neuroticism, openness) and the optimism variable. Describe which of the Big-Five personality factors are significantly correlated with optimism, and interpret the direction and strength of each relationship.
QUESTION 10
Use SPSS Chart Builder to create a Simple Scatterplot depicting the linear relationship between extraversion and optimism. After producing the scatterplot figure, use the SPSS chart editor to add the regression line and coefficient of determination (r2). Paste the final scatterplot figure below and include an APA-style title.
QUESTION 11
Conduct a simple linear regression in SPSS with one predictor examining if extraversion is a predictor of optimism (outcome variable). When specifying the analysis in SPSS, include Extraversion as an Independent(s) and Optimism as a Dependent. Copy and paste (or import) the regression output below.
QUESTION 12
Using the regression output provided for Question 11 above, summarize the results of the regression analysis that examined if extraversion was a significant predictor of optimism. Report and interpret the R Square of the model. Also, report the ANOVA table results and the standardized coefficient weight (Beta) for the extraversion score. Finally, provide at least one sentence interpreting the findings (i.e., is having an extraverted personality a good predictor of one’s optimism?)
Students succeed in their courses by connecting and communicating with an expert until they receive help on their questions

Consult our trusted tutors.


 Login | Sign Up

