Research Problem 2: The Mozart Effect
Use the Research Problem 2 description and the Mozart Effect.sav SPSS dataset to complete the instructed tasks and obtain statistics needed to answer exam questions 13–18 listed below.
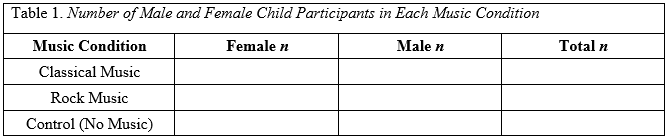
QUESTION 13
Obtain frequency data in SPSS to find the number of male, female, and overall participants (n) in the three Music Conditions of the study. Use the frequency data to fill in the blank cells in Table 1 below. (Hint: You can obtain this data using either Descriptive Statistics Crosstabs… or using the Split File function and Descriptive Statistics Frequencies…)
QUESTION 14
Conduct an independent-samples t-test in SPSS to examine if there are any sex differences in IQ scores. Copy and paste (or import) the t-test output below.
QUESTION 15
Interpret and report the results of the t-test output provided for Question 14. Do there appear to be sex differences in IQ for the sample of children included in your study?
QUESTION 16
Conduct a one-way ANOVA in SPSS to examine the effect of music condition on children’s IQ. When requesting the ANOVA, be sure to request Descriptive, Homogeneity of variance test, Brown-Forsythe, and Welch under the Options… menu. Include Tukey post hoc tests under the Post Hoc… menu. Copy and paste (or import) the one-way ANOVA output below.
QUESTION 17
Using the one-way ANOVA output obtained for Question 16, interpret and report the results of the study. Report the ANOVA results in correct statistical notation, include an appropriate measure of effect size, and interpret the post hoc test results if necessary. Finally, provide at least one sentence interpreting the findings (i.e., do the findings provide support for the proposed Mozart Effect?)
QUESTION 18
Use SPSS Chart Builder to create a Simple Bar Chart showing the mean differences in children’s IQ across the three music conditions included in the study. Be sure to include error bars on the figure depicting the standard error of the mean. After producing the bar chart figure, use the SPSS chart editor to edit the figure. Copy and paste the final figure below and include an APA-style title.
Students succeed in their courses by connecting and communicating with an expert until they receive help on their questions

Consult our trusted tutors.


 Login | Sign Up

