Dataset Description
The data set being analysed comprises the study of 49 candidates for recruitment to be emergency health workers. Each recruit was given a psychological assessment on the following psychometric traits (temperament and character inventory traits, TCIs) of
• Novelty seeking (NS) denoted by NSTCI
• Harm Avoidance (HA) trait denoted by HATCI
• Reward dependence (RD) trait denoted by RDTCI
• Persistence denoted (P) by PTCI
The aim of the study was to establish the best traits and their combination for the optimal choice of recruits for the job.
Question 1:
Use the study context described above and the output of PROC UNIVARIATE below, its plots and numerical values, to answer the following questions.
a) What are p and n in this multivariate data set analytic context?
b) Write down the vector of sample means for the multivariate data (NS, HA, RD, P).
c) On which of the four traits (TCIs) are the individuals scoring highest on? Justify your answers by numerical summary values shown in the output below.
d) On which of the four traits (TCIs) are the individuals scoring lowest on? Justify your answers by numerical summary values shown in the output below.
e) For each variable (or trait, TCI) identify which individual in the study is the highest ranked individual and give their actual attained value for the trait.
f) For each variable (or trait, TCI) identify which individual in the study is the lowest ranked individual and give their actual attained value for the trait.
g) Which of the variables or traits (TCIs) are normally distributed, if any? Justify your answer based on the plots and output provided, state which plot and why.
h) Briefly explain the concept of normal quartiles and how they are used below.
i) Write down the vector of sample medians for the multivariate data (NS, HA, RD, P).
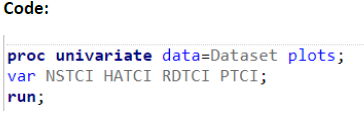
Code:
Students succeed in their courses by connecting and communicating with an expert until they receive help on their questions

Consult our trusted tutors.


 Login | Sign Up

