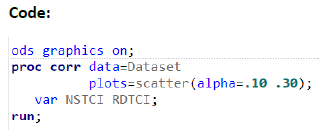
Question 3:
The ODS graphic code below uses PROC CORR to create both 70% and 90% prediction ellipses for the specified variables.
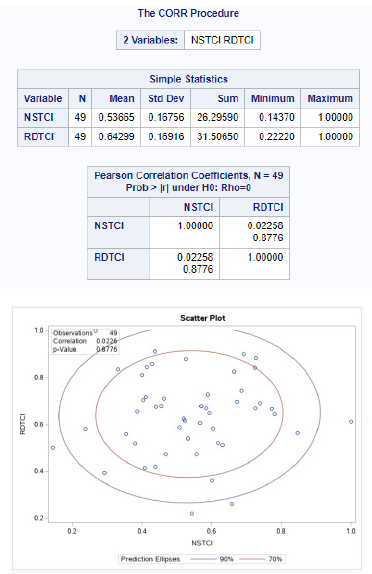
a) What is the ellipse’s centroid written as a numerical vector?
b) How many outliers are there with respect to the 70% and the 90% prediction ellipse?
c) Hypothetically, if the prediction ellipses were created for 80% and 90%, how would the coverage change?
d) Briefly explain what alpha (α) relates to with respect to the prediction ellipses drawn.
e) Using the outputs in Question 1 and Question 2 calculate Hotelling’s T2 statistic which is traditionally used to test for a hypothetical null value for μ’0 = [1.53, 1.64].
HINT: Give the equation for T2 and show all your working, formula and the calculated value showing all your steps.
Output:
Students succeed in their courses by connecting and communicating with an expert until they receive help on their questions

Consult our trusted tutors.


 Login | Sign Up

